


Studying how tumor cells survive under low oxygen conditions

This article is a general overview (written by Stephen Riffle) of a paper (PMID:28521819) published by members of the Hegde lab at Cincinnati Children’s Hospital
Abstract – What’s this all about?
Growing tumor cells in the shape of a ball (aka multicellular tumor spheroids – abbreviated as MCTS), rather than flat on a petri dish has been used in research to mimic an actual tumor because tumors don’t grow flat on a dish, they grow in 3

dimensions. We used this also to study how tumor cells survive when there is very little oxygen. Look at the section titled background to understand why we wanted to look at this.
What methods did we use?
We formed these MCTS from a Ewing Sarcoma cell line which is a cancer of the bone and soft tissue, most frequently found in children. We froze these spheres in an ice block, then cut them with a big deli slicer so we could look at the sphere face on. Think of it like cutting an apple in half so you can look at where the seeds are in the core of the apple. To ask our questions, we mostly used immunofluorescence which is a technique where we can make certain proteins glow. We then took pictures of these glowing proteins and looked at where in the MCTS they are, and how they correlated to various conditions. Then we asked if certain chemotherapeutics could affect these proteins. If you think back to the apple analogy, we make the seeds glow so we can see where if they are located in the core, or more near the outside of the apple.

Just an aside, a protein is the functional unit of a cell. Think of a cell like a tool box, various proteins serve different functions, just like different tools (screw driver vs wrench) serve different functions. Most of our research is looking to see what these tools are doing, who's using them, and are they contributing to disease progression.
Results (in brief)
We found that we could use MCTS to study the condition known as hypoxia (low oxygen, the cells are suffocating). We saw that there are some cells going into survival mode under these conditions and that we could use this model (MCTS) to study how they try to survive. We also saw that we could use some therapeutics to specifically target them.
Conclusions (in brief)- why does it all matter?
This study is cool because it established MCTS as a model for studying how tumor cells survive under low oxygen conditions. In patients, cells that are suffocating enter survival mode and can actually survive many therapies we use (that’s bad). These cells go on to regrow a tumor and they're usually more aggressive. By showing that we can study this population of cells in the MCTS model, we open the door for future researchers to explore these methods of survival and figure out how to kill them more effectively and ultimately increase patient survival.
Background
Every cell in your body needs oxygen, that’s why you breathe and that’s why you’ve got blood vessels. Blood vessels extend throughout your body to deliver oxygen to every cell from your skin to your liver and on to your brain. When you get a tumor though, the body isn't prepared for it meaning there aren’t any blood vessels there to give the tumor oxygen. Without vessels, parts of the tumor begin to suffocate, leading to a freak out response.
We call these conditions hypoxic, or being in a state of hypoxia. When they’re in these conditions, the tumor cells will freak out. They start calling out to the body asking for blood vessels. The body doesn’t know any better so it starts to grow new vessels. These vessels aren’t very good though so most solid tumors have some regions that are hypoxic. The hypoxic cells continue to freak out, many of them die but some of them go into a turtle like state where they just hunker down and try to wait out the storm. This is bad because many of our therapeutics rely on oxygen to have their maximal effect and most of them target cells that are actively growing. Hypoxic cells pause in the middle of growth. We don’t know why some cells survive these conditions and wanted to establish a system for studying these cells.

Studying hypoxic cells is hard though because a real tumor is very dynamic; it’s like a city – always in motion and always changing. Most research studies try to understand tumor biology by growing tumor cells on petri dishes. You can grow these cells on a dish, throw different inhibitors on them and ask if the cells move less or if it kills them. It’s fast and very informative, but it’s obviously pretty different from what happens in your body. It’s like studying a fish tank to represent the ocean.
Multicellular tumor spheroids (MCTS), or tumor cells grown as a ball rather than flat on the dish, help us get closer to recreating that ocean. With this model, we can make the cells behave much more similar to how they would in a patient. People have used these before but they haven’t used them to really study the biology of tumor cells when they’re suffocating, or hypoxic. We wanted to establish MCTS as a model system where we could study this.
Methods section: The methods section is super technical but see the methods listed on the first page for a general statement. If you have more questions or want me to go more in depth on it, just let me know, I’d be more than happy to! I’ll try to kind of explain as we go too. The most important thing for you to understand regarding the methods is that throughout this paper you will see pictures of the spheres. I want you to understand what the pictures are though so you have to be oriented. Think of them as a face on look at the sphere, just like I said earlier where you take an apple and cut it in half to look at the core. That’s what we’ve done here.
Results:
For this section I’m just going to go figure by figure.
Figure 1 is showing you that we were able to actually form MCTS with two cell lines, one is from a Ewing Sarcoma patient and one is actually from a mouse that had lung cancer. Both cell lines are commonly used in cancer research for various reasons. Figure 1a represents their growth over time. The point was just to show that we could form them and they would grow in a predictable manner. The predictable part is really important because we need a good model that acts the same every experiment. Otherwise it would be difficult to really conclude that our inhibitors were the cause of any variations. So we were able to form them and they grew in a reproducible manner.

In Figure 1B we used a staining technique where we pretty much take two different colored dyes which stick to and represent living or dead cells. The deep purple is living and the pink are dead. In real tumors, a lot of cells die when they’re suffocating (hypoxic) so it’s common to have big pockets of dead cells in the most oxygen starved regions of tumors. Seeing it in our MCTS is a good sign that we are recreating a tumor environment. If you’re interested, scientists have identified several different ways a cell can die. In this paper we talk about two of them – termed apoptosis or necrosis. Apoptosis is when the cell cordially kills itself. Necrosis is when it goes out in flames.
Because we are interested in studying how cells survive when there is little oxygen, we had to see if there were regions within the MCTS that had low oxygen. Past studies have shown the central portion of MCTS to be low in oxygen (hypoxic) so we expected that to be the case.
In figure 2a we used a marker of hypoxia (shown in red) to identify where there was critically low oxygen. The blue in this figure just represents a cell’s nucleus, you can think of each blue dot as representing one cell. You can see that in the small MCTS, there’s not really any suffocating occurring. As they get bigger though (middle and far right) the center of the spheres becomes oxygen starved which correlates with the development of cell death (observed in figure 1b). After seeing these results we now know that we can form MCTS from these cells and if we wait 5 days they will always have a hypoxic core in the patterns you see here. So now we have a predictable model.
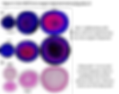
In figure 2b, we wanted to see if the hypoxia was affecting the cells. There have been reports that they start holding onto sugar (glucose) like mad when they’re oxygen starved because the last thing they want is to be hungry while they’re suffocating. Here we looked to see if they were doing this. The deep pink represents stores of glucose (in the form of glycogen). You can see that medium sized spheres start holding onto glucose specifically in the hypoxic region. These results confirm that our model can be used to study this process in tumor cells and might be useful for researchers interested in targeting glucose storage in tumor cells.
In figure 3 we start getting more in depth with how the tumor cells are behaving. The first two parts (a and b) are looking at which cells are growing. Again, the blue represents individual cells. The red in part A shows you all cells who are trying to replicate (make copies of themselves – this is the core characteristic of cancer cells that makes them deadly, they won’t stop doing this). You can see the red is pretty much in all layers of the sphere, even near the center. In the last figure we showed you that the center is oxygen starved, so we were

surprised to see that they could still be growing. To ask who is actually successful in this growth, we used a different marker in part b. This marker is equivalent to handing out trophies at a finish line. Only cells that have successfully completed replication will hold onto our green marker. This figure shows you that only the cells on the outside of the sphere are actually able to complete replication. Part c of figure 3 is just describing apoptosis (casual and formal cell death). The central localization of this marker tells us that the central region is not good for the cells and increases our confidence that cells in this part of the sphere are probably stressed out.
Fig 3 is important. This tells us that there are cells trying to grow in the hypoxic region of spheres but are currently paused, and potentially hunkered down in survival mode.
All of this tells us that MCTS are recreating those cells that hunker down and enter survival mode when there is a dangerously low oxygen concentration.
So, we have cells in the hypoxic zone trying to grow. How are they still alive??? Or how are they trying to stay alive? Some studies before us suggested that these cells survive by padlocking their DNA. They pull out proteins (think of them like tools in a tool kit, these ones would be the equivalent of vice grips or padlocks) who can lock the cell’s DNA in place and stop it from being replicated. What I haven’t said yet is that when tumor cells are trying to grow, or replicate, they have to open the DNA and make a copy of it so that each duplicate cell has one copy of DNA. If a cell’s DNA gets broken, the cell will mutate or die. There’s evidence that oxygen starvation, suffocating, could cause the DNA to break and kill the cell. To stop this, cells pull out some tools and lock the DNA down.
They put it in a protected state to stop anything from breaking it. The tools they use for this are collectively referred to as DNA damage repair proteins; we use DDR as shorthand for DNA damage repair – the general process of pulling these tools out and using them.
We have a model where these cells are in survival mode, under conditions very similar to what actually happens in a patient. So now we asked if they are using these DNA damage repair (DDR) proteins to survive.
Figure 4 is looking at one specific DDR protein called γ-H2AX. This is one of the first tools pulled out to lock the DNA down and protect it. In part a you can see that the medium sized spheres, the ones who have a hypoxic core with survival mode cells, has an enrichment of γ-H2AX. This suggests that those hypoxic cells are activating DDR proteins as part of their survival mode. You can see that γ-H2AX is not only in the hypoxic zone, that’s because there are many reasons DNA can be damaged so this tool is being used by other cells as well, however in the middle sized spheroids we see a consistent and specific localization in the hypoxic region.

Part B asked if γ-H2AX was in the cells who are both hypoxic and in a state of paused growth. To do this we used the marker γ-H2AX (red) and the same marker you saw in figure 3a showing cells that are trying to grow (green). Where you see yellow is overlap and you can see that many cells, both in the hypoxic zone and out of it are using γ-H2AX to try and protect their growing cells, but almost every cell that is trying to grow in the hypoxic zone are using γ-H2AX.
This tells us that those cells are using DDR proteins to try and survive.
In Figure 5 we wanted to ask what other tools were being used in this DDR and if we could use therapeutics to target those tools. HIF-1a is a protein that is used under hypoxia. It drives a lot of the cellular adaptations when a cell becomes oxygen starved. HIF is like a project manager, its directing a lot of activities. Some recent studies showed that HIF proteins can be regulated by some DDR proteins so we show here in part a that HIF is present in the hypoxic cell layers indicating that hypoxia is present and the cells are actively trying to adapt, this is consistent with what we’ve seen so far. In part b we looked at the protein ATM which is a protein known to be a part of the DDR tool belt and is routinely used by your cell whenever it detects potential threats. ATM also is known to stabilize HIF and is responsible for pulling γ-H2AX out for use.

We see in Figure 5 that ATM is being used in the central hypoxic zone (red), in a similar pattern to what was seen with hypoxia, γ-H2AX, and HIF. All of this suggests that when cells are suffocating, they trigger ATM to direct a survival mode including the formation of γ-H2AX in cells that are growing.
In parts C-F we asked if we could use a drug that specifically targets ATM to prevent γ-H2AX formation. The theory is that inhibiting ATM would prevent the cells ability to use its protective tool box and would then die. By using this inhibitor we are able to do two things: 1. Ask if inhibition of ATM successfully prevents hypoxic cells from using γ-H2AX in their attempt to survive. 2. Confirm that ATM is actually the protein responsible for pulling γ-H2AX out of for use rather than just being correlated to γ-H2AX expression. In this figure, we see that ATM is important for γ-H2AX formation under hypoxia because when we inhibited it, there was a decrease in the amount of γ-H2AX.
The take home is that ATM is active and targetable in these dangerous cells.
In figure 6 we wanted to confirm that it’s actually the development of hypoxia that causes all of this. Again, this is showing causation, rather than correlation. To do this, we took small MCTS before they have a hypoxic center. These spheroids breathe alright. So we took them and put them in a box, and then sucked the oxygen out of there. With this experiment we asked if we saw an increase in ATM and γ-H2AX as a result of oxygen deprivation. You can see in parts B and C on the right hand side that we did see an increase confirming that hypoxia is inducing this DDR survival mode.

In figure 7, we asked if the small molecule we used in figure 5 would have similar effects on spheroids when we forced oxygen deprivation (same method as in figure 6). This allowed us to ask if ATM is responsible for γ-H2AX use in response to hypoxia. It’s necessary to ask this because, although they are

clearly correlated and in the larger spheres we see that ATM is necessary for γ-H2AX, it’s possible that the link between ATM and γ-H2AX is the result of longer growth time for the spheroid rather than hypoxia. Predictably we saw less γ-H2AX when we inhibited ATM under hypoxia.
Figures 6 and 7 confirm that hypoxia induces ATM to pull γ-H2AX out of the tool belt in an attempt to survive. What’s not shown is cell death data here; however we did perform this analysis and did in fact see that loss of this DDR response caused these cells to die.
It’s interesting that hypoxia is causing these cells to act as though their DNA is damaged (by activating ATM and γ-H2AX) because previous studies suggested that there was no damage under these conditions. In those studies, the authors provided evidence to suggest that hypoxia induces a DDR but that a different protein (ATR) is used rather than ATM to form γ-H2AX. It’s complicated and not fully understood, but the general thinking in this field is that ATR uses γ-H2AX to protect DNA when its DNA is vulnerable, but not yet damaged. In contrast they think that ATM uses γ-H2AX after the DNA has been damaged. We see ATM being used meaning that there might actually be damage caused by suffocating the cells. Unfortunately we couldn’t probe our MCTS directly for DNA damage so we had to use monolayers (cells grown just as boring flat cultures on a dish). It’s easier and there are fewer variables.

Figure 8 does just that. It looks at 2D cultured cells either grown normally or under oxygen starved conditions. Parts A, B, D just look to see if oxygen deprivation causes γ-H2AX as it does in our MCTS. To ask if the DNA is damaged, we used what’s called a comet tail assay (part C). Basically what we did was to take the DNA out of some cells and pass them through a porous gel. To understand this experiment, you should think of the DNA like a long line of people linking their arms. Now image a line of 100 people trying to squeeze through a single door, it’s going to take time for them to reorient themselves to move through that door. But if there is a break in that line, if some people stop linking their arms, you’re going to get everyone through a lot quicker.
This assay looks at how fast the DNA moves away from its solid red clump. To move away, it has to pass through little holes which is hard if the DNA isn’t broken. The longer the red streak is, the faster the DNA was able to move meaning the DNA is more damaged than a smaller streak. Using this assay, we showed that hypoxia was actually breaking the DNA. This is significant because it implies that other proteins we know respond to broken DNA may also be involved (and could then be targeted by therapeutics). More studies would have to be done though to confirm this. Finally we asked if inhibiting ATM in this system also prevented γ-H2AX under hypoxia, which it did thus confirming that ATM is the one responsible for γ-H2AX formation. I didn’t talk much about ATR here, but we did look at that protein and found it to act differently under different culture conditions. To know more about this, shoot me a message and I can explain!
Ultimate take home message:
What did we actually learn and why does it matter? From these studies, we learned that the MCTS can be used to study the ways in which tumor cells try to survive when they are being suffocated. This is really important because we don’t have great ways to study this process, and to this point we only have hints about how they do this. By establishing this model and then validating its use, we enable future studies to use this system to develop better therapeutics. Our studies suggest that targeting proteins like ATM or other proteins responsible for γ-H2AX formation could help improve our efficacy when treating hypoxic tumors.
Thanks for reading and if you have any question please please feel free to email me!
Stephen.riffle@cchmc.org